Breeding Bird Atlases (BBA)
Find a Bird
Wood Thrush
Hylocichla mustelina
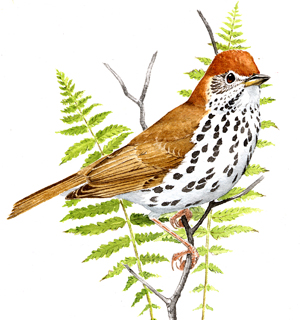
Very widespread and likely declining
Action/monitoring needed
State Wildlife Action Plan listed

“The thrush alone declares the immortal wealth and vigor that is in the forest.” – Henry David Thoreau, Journal
Thoreau wrote these words about the song of the Wood Thrush, the only forest thrush with enough tolerance for people to live in the modest woods near Thoreau’s Concord home during the 1800s. The Wood Thrush’s willingness to live near humans has allowed it to become the most widespread forest thrush in the Commonwealth. Its beautiful song can still be heard in nearly any deciduous or mixed forest of moderate size throughout the state, but there is evidence these familiar songsters are undergoing a quiet decline.
Historic Status
The loss of forest habitat in Massachusetts was apparently not a deterrent for the Wood Thrush the way it was for many forest species, since the species was recognized as a regular resident of the state even in the 1830s (Peabody 1839). By the beginning of the twentieth century, the species was known as a common breeder in Connecticut, a local breeder in Massachusetts, and rare in New Hampshire and Vermont (Forbush 1929). Because the species was near the northern edge of its range in the Commonwealth, the return of woodlands to Massachusetts could only portend good times ahead. And so it went, and the twentieth century witnessed a northward expansion of the Wood Thrush into New Hampshire and Maine.
Atlas 1 Distribution
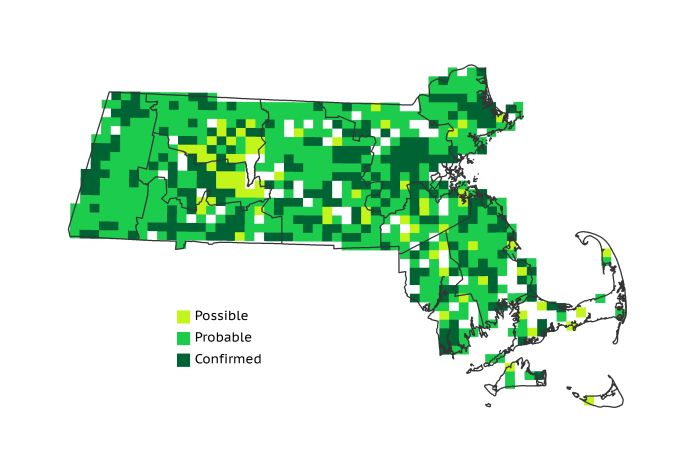
The clear fluted song of this species could readily be heard throughout Massachusetts by the time of Atlas 1, from deep mountain forests to small suburban woodlots in 80% of the blocks surveyed. Both the Marble Valleys and the Vermont Piedmont had 100% block occupancy, and the Berkshire Highlands and Lower Berkshire Hills lacked Wood Thrushes in only a few blocks. Breeding Wood Thrushes were also very widespread through the Berkshire Transition into the more open Connecticut River Valley. Block occupancy remained above 75% moving eastward until the Cape Cod and the Islands, which was the least hospitable region to Wood Thrushes by a large margin; only 32% of the region reported breeding activity.
Atlas 2 Distribution and Change
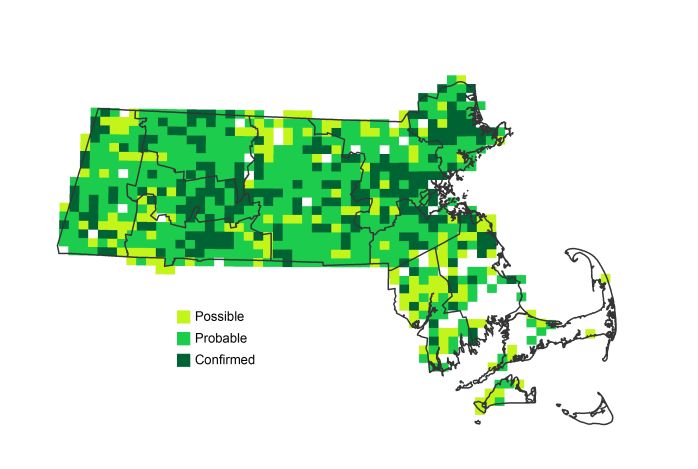
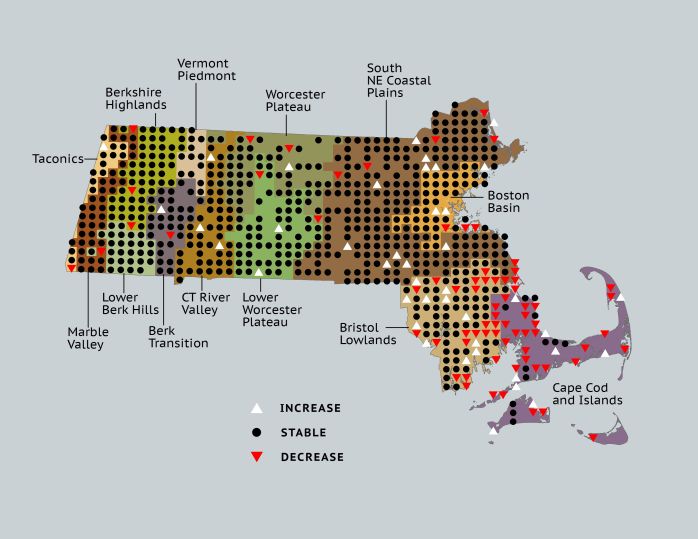
Concern was being raised over the trend of Wood Thrush numbers during the interval between Atlas 1 and 2, and the results shown in Massachusetts by Atlas 2 reveal a complex pattern of range retention, minor expansion, and loss for this species. Western regions showed nearly uniform block occupancy, with a small net loss in block occupancy for the Marble Valleys, Berkshire Highlands, and Worcester Plateau. The pattern of loss becomes clearer in the eastern sections of the state, with the Bristol Lowlands and Cape and Islands posting notable losses in block occupancy. For this species it is important to view the effort-controlled data rather than the overall Atlas data. Net losses in the Bristol/Narragansett Lowlands and the Cape and Islands account for much of the species’ decline in the state.
Atlas 1 Map
Atlas 2 Map
Atlas Change Map
Ecoregion Data
Atlas 1 | Atlas 2 | Change | ||||||
Ecoregion | # Blocks | % Blocks | % of Range | # Blocks | % Blocks | % of Range | Change in # Blocks | Change in % Blocks |
Taconic Mountains | 14 | 87.5 | 1.8 | 21 | 84.0 | 2.6 | 0 | 0.0 |
Marble Valleys/Housatonic Valley | 39 | 100.0 | 5.0 | 37 | 94.9 | 4.5 | -2 | -5.1 |
Berkshire Highlands | 54 | 98.2 | 6.9 | 53 | 96.4 | 6.4 | -2 | -3.8 |
Lower Berkshire Hills | 27 | 96.4 | 3.5 | 30 | 96.8 | 3.6 | 0 | 0.0 |
Vermont Piedmont | 17 | 100.0 | 2.2 | 17 | 100.0 | 2.1 | 0 | 0.0 |
Berkshire Transition | 35 | 92.1 | 4.5 | 39 | 97.5 | 4.7 | 0 | 0.0 |
Connecticut River Valley | 51 | 91.1 | 6.6 | 64 | 98.5 | 7.8 | 3 | 6.3 |
Worcester Plateau | 70 | 89.7 | 9.0 | 81 | 92.0 | 9.8 | -2 | -4.2 |
Lower Worcester Plateau | 62 | 83.8 | 8.0 | 78 | 97.5 | 9.5 | 1 | 1.9 |
S. New England Coastal Plains and Hills | 237 | 87.8 | 30.5 | 256 | 90.5 | 31.1 | 3 | 1.3 |
Boston Basin | 43 | 76.8 | 5.5 | 42 | 75.0 | 5.1 | -1 | -1.8 |
Bristol and Narragansett Lowlands | 85 | 80.2 | 10.9 | 77 | 67.5 | 9.4 | -10 | -9.9 |
Cape Cod and Islands | 44 | 32.4 | 5.7 | 28 | 19.4 | 3.4 | -20 | -16.7 |
Statewide Total | 778 | 80.3 | 100.0 | 823 | 79.4 | 100.0 | -30 | -3.6 |
Notes
The Wood Thrush shows a significant decreasing Breeding Bird Survey trend in Massachusetts, in the New England/Mid-Atlantic Region, and in the Eastern US overall.


