Breeding Bird Atlases (BBA)
Find a Bird
Eastern Bluebird
Sialia sialis
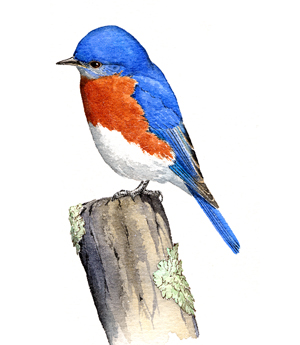
Very widespread and strongly increasing

“The Bluebird of Happiness long absent from his life, Ned is visited by the Chicken of Depression.” – Gary Larson, The Far Side
The first English colonists found the forests and fields of what would be called America to be full of seemingly familiar faces. The New World had its own birds that reminded them of the robins and goldfinches of home, and they named them accordingly. That said, perhaps no bird of the English countryside could have prepared them for the Eastern Bluebird, whose brilliant blue feathers, red breast, and cheery song have made the species a symbol of happiness in our culture. Fittingly, the news for bluebirds in Massachusetts is better today than it has been for some time.
Historic Status
When the first settlers arrived on our shores, they marveled at the beauty of the “Blue-Robin,” and soon came to know it as a sign of the warmer seasons to come, “a delightful messenger of spring, whose early appearance makes us ask, ‘Hast thou a star to guide thy path?’ since he comes before the fetters of Orion are unbound, or the sweet influences of Pleiades have begun to fall” (Peabody 1839). House Sparrows, the introduced competitor for nesting cavities, began moving out of the cities in the 1870s and drove many Eastern Bluebirds from their nests. A harsh winter in 1895 nearly extirpated them from New England (Forbush 1929). Throughout the twentieth century, the battle for survival continued as bluebirds competed with House Sparrows and European Starlings for nesting sites, faced landscape-level habitat changes, confronted adverse weather events, were contaminated by pesticides, and more. By the 1970s, the Northeastern population had declined by 90% (Petersen & Meservey 2003).
Atlas 1 Distribution
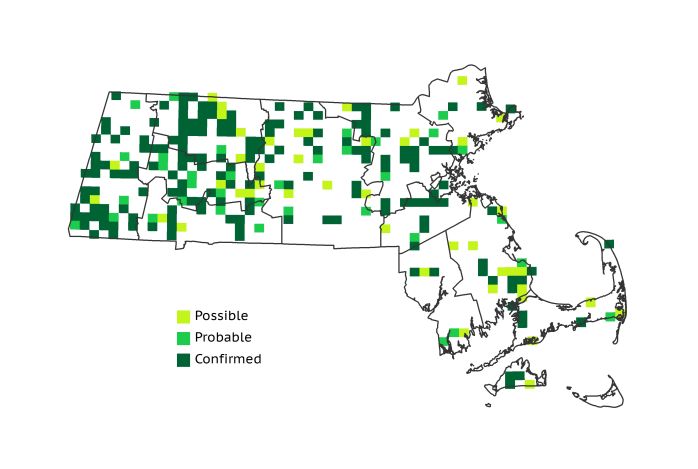
Contrary to their name, Eastern Bluebirds were most concentrated in the western parts of Massachusetts during Atlas 1. The Marble Valleys, Berkshire Transition, and Vermont Piedmont were thick with bluebirds, posting the highest percentages of occupied blocks, all hovering in the 50-65% range. The birds’ surprising scarcity in the Connecticut River Valley, where they were found in only a third of all blocks despite plenty of apparently available habitat, is interesting. Bluebirds were also present in about 33% of blocks in the Worcester Plateau regions, and an even smaller proportion in the rest of the state. Many bluebirds in the eastern regions nested in boxes put up for their use, a trend that would ultimately benefit the species in the years ahead.
Atlas 2 Distribution and Change
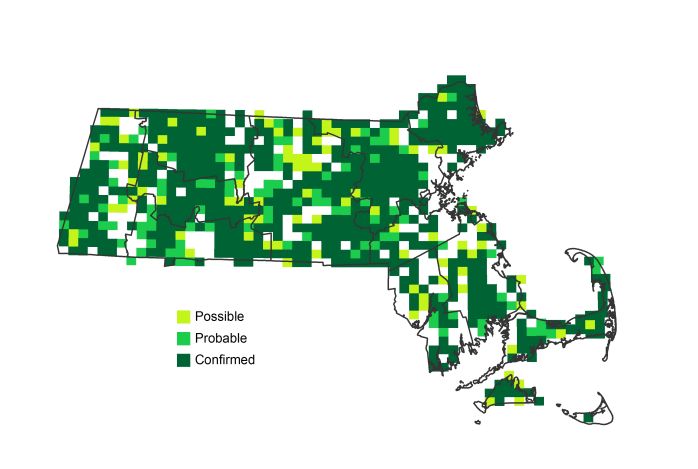
Demonstrating an impressive resiliency and acting as an icon for the conservation movement, the recovery of the Eastern Bluebird represented the product of the hard work of thousands of volunteers across the eastern United States. Increasing from 254 to 713 occupied blocks from Atlas 1 to Atlas 2, their recovery was impressive. Confirmation rates skyrocketed for the species, from 18% to 50% as nest boxes became commonplace on the landscape making the species even more obvious as it went about its housekeeping duties. Examining only the effort-controlled blocks, one of the remarkable features of this species was its stability – it was only lost from 37 blocks where it was found during Atlas 1. The species was widespread across all regions, and occupied more than 40% of each and every region in the state. Its block occupancy generally declined eastward, with the strongest presence in the Vermont Piedmont, Marble Valleys, Berkshire Transition, and Coastal Plains.
Atlas 1 Map
Atlas 2 Map
Atlas Change Map
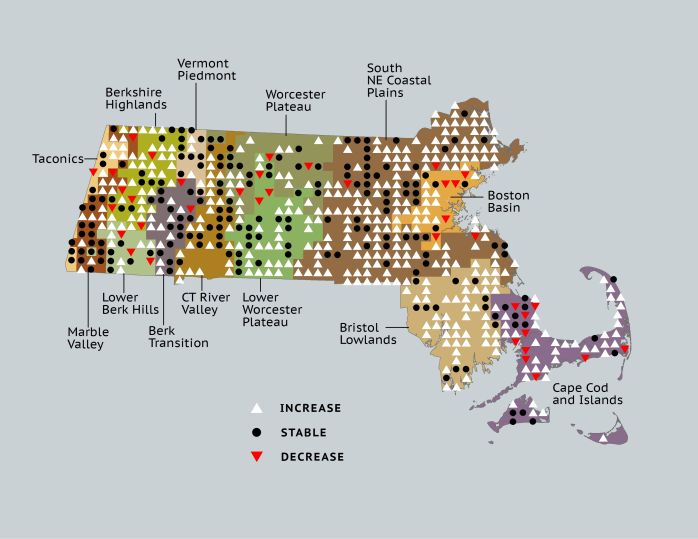
Ecoregion Data
Atlas 1 | Atlas 2 | Change | ||||||
Ecoregion | # Blocks | % Blocks | % of Range | # Blocks | % Blocks | % of Range | Change in # Blocks | Change in % Blocks |
Taconic Mountains | 6 | 37.5 | 2.4 | 14 | 56.0 | 2.0 | 5 | 33.3 |
Marble Valleys/Housatonic Valley | 20 | 51.3 | 7.9 | 35 | 89.7 | 4.9 | 15 | 38.5 |
Berkshire Highlands | 18 | 32.7 | 7.1 | 42 | 76.4 | 5.9 | 23 | 43.4 |
Lower Berkshire Hills | 10 | 35.7 | 3.9 | 17 | 54.8 | 2.4 | 5 | 18.5 |
Vermont Piedmont | 11 | 64.7 | 4.3 | 17 | 100.0 | 2.4 | 4 | 33.3 |
Berkshire Transition | 20 | 52.6 | 7.9 | 32 | 80.0 | 4.5 | 8 | 25.8 |
Connecticut River Valley | 19 | 33.9 | 7.5 | 51 | 78.5 | 7.2 | 23 | 47.9 |
Worcester Plateau | 26 | 33.3 | 10.2 | 67 | 76.1 | 9.4 | 19 | 39.6 |
Lower Worcester Plateau | 24 | 32.4 | 9.4 | 61 | 76.3 | 8.6 | 22 | 40.7 |
S. New England Coastal Plains and Hills | 55 | 20.4 | 21.7 | 227 | 80.2 | 31.8 | 135 | 59.7 |
Boston Basin | 9 | 16.1 | 3.5 | 23 | 41.1 | 3.2 | 14 | 25.5 |
Bristol and Narragansett Lowlands | 12 | 11.3 | 4.7 | 62 | 54.4 | 8.7 | 48 | 47.5 |
Cape Cod and Islands | 24 | 17.6 | 9.4 | 65 | 45.1 | 9.1 | 30 | 25.0 |
Statewide Total | 254 | 26.2 | 100.0 | 713 | 68.8 | 100.0 | 351 | 42.3 |
Notes
The Eastern Bluebird shows a significant increasing Breeding Bird Survey trend in the New England/Mid-Atlantic Region and in the Eastern US overall. The growth and persistence of this species is due, in large part, to a dedicated army of volunteers who have built bluebird houses, maintained nest boxes, and improved habitat for these charismatic birds. Their iconic role in song and literature, as well as their successful recovery due to the hard work of volunteer conservationists, underscores the strong connection many people feel to birds and their conservation.


