Find a Bird
Eastern Phoebe
Sayornis phoebe
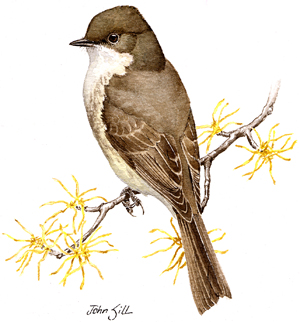
Nearly ubiquitous and likely increasing
“Nothing daunted, Phoebe built upon the old foundation, plastering with mud and moss the whole outside of the nest.” – Althea R. Sherman, Birds of an Iowa Dooryard
The sneezy-sounding fee-bee, fee-brreedit! song of the Eastern Phoebe fills the air during the first days of spring in Massachusetts. Eastern Phoebes are early migrants among the flycatcher clan, and most males are already on territory by the first week of April. The males sing lustily throughout the day to protect their territory from other birds and are almost difficult to overlook during the early season. Their willingness to avail themselves of human-modified nesting sites year after year, along with their ability to rear two broods per season, has helped this species to expand in the state.
Historic Status
Effusive praise has followed the Eastern Phoebe throughout time in Massachusetts. “The Pewit Flycatcher,” wrote William Peabody in 1839, “commonly known by the name of phoebe, is a familiar and welcome bird; not valued for its beauty or its song, in both which respects it is deficient, but held in general esteem, because it reposes confidence in man” (Peabody 1839). Henry Davis Minot felt the same way in 1877. “There are few birds dearer to an ornithologist than the [Phoebe], and no birds are better entitled to the affection of a friend, if usefulness, cheerfulness, familiarity towards man, and charm of manner, deserve our regard” (Minot 1877). It was, in fact, humans who aided the expansion of the species because it readily made its nests on human structures, particularly bridges, carrying the epithet “Bridge Phoebe” for many years.
Atlas 1 Distribution
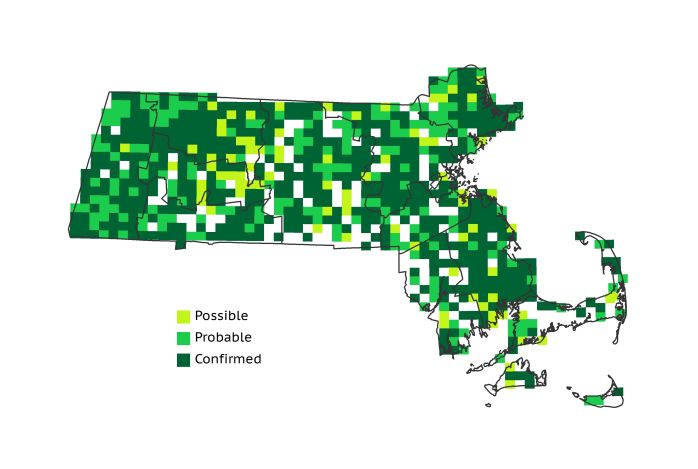
The needs of Eastern Phoebes – a small opening in the forest, a ledge or eave on which to build a nest, and plenty of insects to eat – were met all across Massachusetts during Atlas 1, as evidenced by the species’ extensive range. Phoebes were widespread in western Massachusetts, where small towns and big cities alike provided the necessary infrastructure for nest building while still retaining healthy populations of flying insects. Phoebes were slightly less widespread in the Worcester and Lower Worcester Plateau areas, though this may in part have been due to uneven survey coverage. Phoebes bred in much of the Coastal Plains and the Boston Basin, though they were absent from downtown Boston. The Bristol/Narragansett Lowlands also had breeding phoebes in more blocks than not, but Cape Cod and the Islands was the only region to report lower than 50% block occupancy.
Atlas 2 Distribution and Change
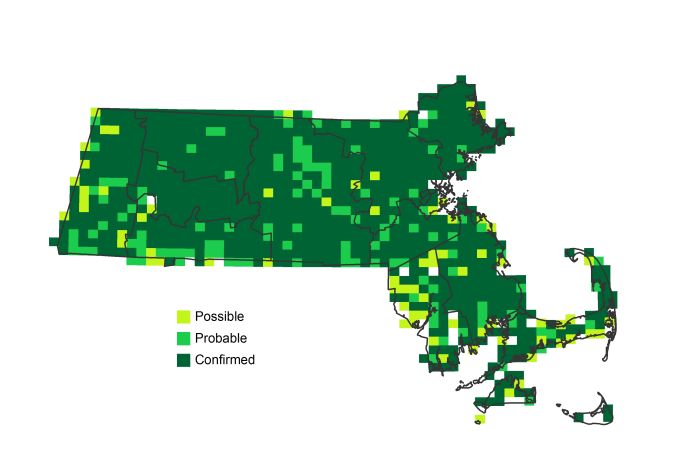
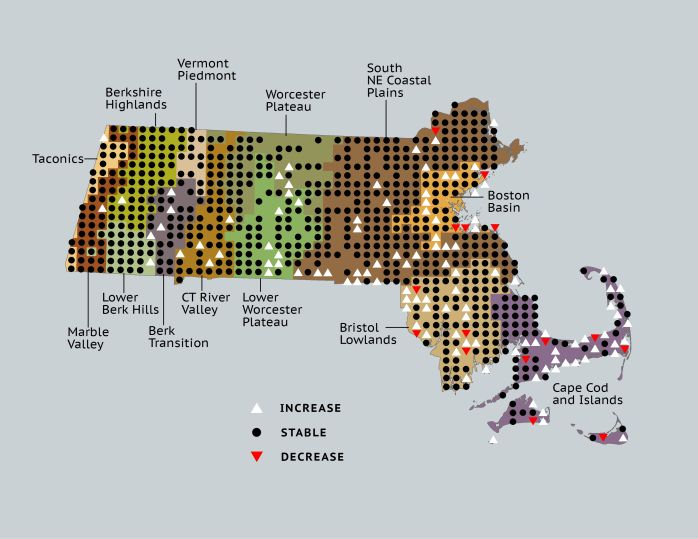
The years between Atlases were kind to Eastern Phoebes, and the species increased in every region except the Vermont Piedmont, which maintained 100% occupancy. Increases were small in the western parts of the state, where phoebes were already prevalent in Atlas 1, and the impressive increases in the central regions may be to some degree an artifact of greater survey effort. Most of the species’ growth was in the east. Two dozen overall new blocks in the Coastal Plains and 13 in the Boston Basin indicated that the phoebes’ penchant for cohabitating with humanity was as strong as ever. The Bristol/Narragansett Lowlands also experienced an upsurge in Eastern Phoebe breeding activity, and the Cape and Islands had the largest increase of any region in the Commonwealth, with phoebes found in 30 new blocks overall.
Atlas 1 Map
Atlas 2 Map
Atlas Change Map
Ecoregion Data
Atlas 1 | Atlas 2 | Change | ||||||
Ecoregion | # Blocks | % Blocks | % of Range | # Blocks | % Blocks | % of Range | Change in # Blocks | Change in % Blocks |
Taconic Mountains | 14 | 87.5 | 1.9 | 21 | 84.0 | 2.2 | 1 | 6.7 |
Marble Valleys/Housatonic Valley | 38 | 97.4 | 5.1 | 39 | 100.0 | 4.2 | 1 | 2.6 |
Berkshire Highlands | 54 | 98.2 | 7.2 | 55 | 100.0 | 5.9 | 1 | 1.9 |
Lower Berkshire Hills | 27 | 96.4 | 3.6 | 30 | 96.8 | 3.2 | 1 | 3.7 |
Vermont Piedmont | 17 | 100.0 | 2.3 | 17 | 100.0 | 1.8 | 0 | 0.0 |
Berkshire Transition | 32 | 84.2 | 4.3 | 39 | 97.5 | 4.2 | 4 | 12.9 |
Connecticut River Valley | 47 | 83.9 | 6.3 | 61 | 93.8 | 6.5 | 5 | 10.4 |
Worcester Plateau | 68 | 87.2 | 9.1 | 87 | 98.9 | 9.3 | 4 | 8.3 |
Lower Worcester Plateau | 57 | 77.0 | 7.6 | 80 | 100.0 | 8.5 | 7 | 13.0 |
S. New England Coastal Plains and Hills | 225 | 83.3 | 30.0 | 270 | 95.4 | 28.8 | 22 | 9.7 |
Boston Basin | 34 | 60.7 | 4.5 | 44 | 78.6 | 4.7 | 10 | 18.2 |
Bristol and Narragansett Lowlands | 76 | 71.7 | 10.1 | 98 | 86.0 | 10.4 | 16 | 15.8 |
Cape Cod and Islands | 61 | 44.9 | 8.1 | 97 | 67.4 | 10.3 | 24 | 20.0 |
Statewide Total | 750 | 77.4 | 100.0 | 938 | 90.5 | 100.0 | 96 | 11.6 |
Notes
Although our previous State of the Birds 2011 report noted that the Eastern Phoebe was declining in the Massachusetts Breeding Bird Survey, new Breeding Bird Survey analyses have not shown a significant trend for this species.


