Breeding Bird Atlases (BBA)
Find a Bird
Least Flycatcher
Empidonax minimus
Fairly widespread and stable
Action/monitoring needed
“You may know that the chebec is not one of those deliberate searchers of foliage by his sudden, murderous sallies in mid-air.” – Neltje Blanchan, Birds Every Child Should Know
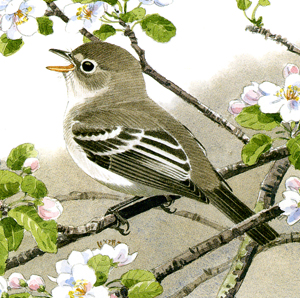
True to its name, the Least Flycatcher is the smallest of the Empidonax flycatchers breeding in Massachusetts. Despite, or perhaps because of, its stature, it is pugnacious, with males frequently chasing each other vigorously about their breeding grounds. Breeding territories of this species are often arranged in “clusters,” wherein many territories will exist within a relatively small area of habitat, despite the presence of additional suitable habitat nearby. Once the most widespread species of their clan in the Bay State, Least Flycatchers are now showing signs of decline.
Historic Status
Just how long the Least Flycatcher has been in Massachusetts is a topic open for debate. An 1839 survey reported to the state legislature does not list the Least Flycatcher either by that name or its colloquial appellation, the Chebec; however, it does recognize what Audubon was then calling the Small-headed Flycatcher (Peabody 1839). Were they one and the same species? Regardless, Least Flycatchers have no doubt lived in accordance with their habitat needs. Their preference for mixed deciduous forests, orchards, shrublands, and agricultural lands has resulted in a slow decline over the past century as the landscape has reverted to forests in the denouement of the farming era, especially in the eastern half of the state.
Atlas 1 Distribution
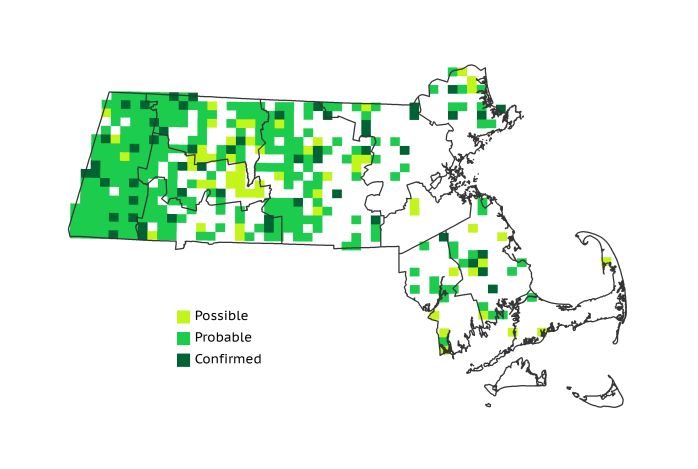
Least Flycatchers were widespread in Atlas 1, but their distribution was notably lopsided. The far western ecoregions had flycatchers practically throughout, with 100% occupancy in the Marble Valleys. Occupancy dropped from nearly ubiquitous to merely widespread in the Berkshire Transition and Vermont Piedmont regions, and the species’ distribution was actually somewhat sparse in the Connecticut River Valley. The percentage of occupied blocks climbed over 60% again through the Worcester and Lower Worcester Plateau regions, but then dropped to roughly 25% through the Coastal Plains and Bristol/Narragansett Lowlands. The Boston Basin had no Least Flycatchers at all, likely due to a paucity of appropriate habitat, and the Cape and Islands had only half a dozen occupied blocks.
Atlas 2 Distribution and Change
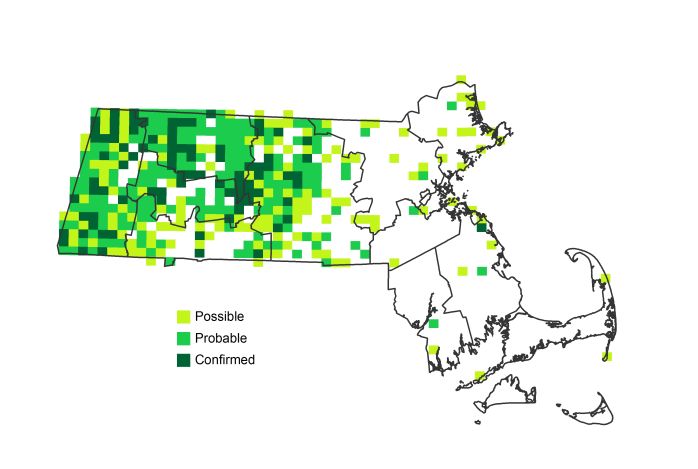
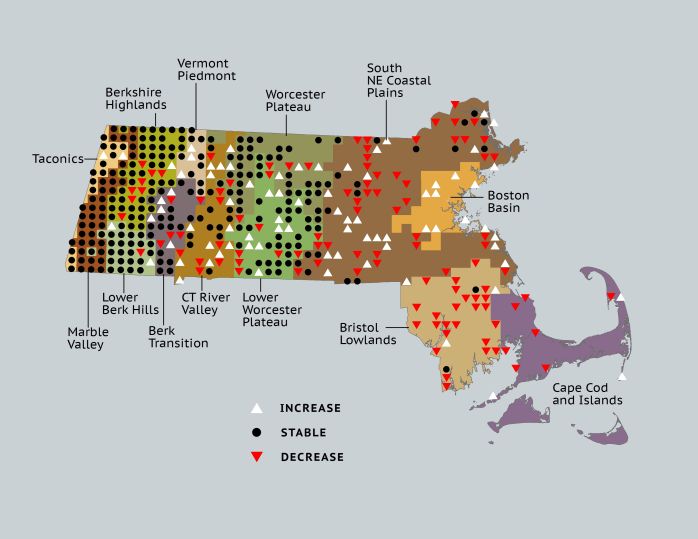
Throughout much of western Massachusetts, the historic stronghold for the species, Least Flycatchers were either stable or slightly increasing during Atlas 2, save in the Berkshire Highlands where they declined in 7 blocks. Despite a suggested modest overall increase in the central part of the state, the effort-controlled data reveals that the species was merely stable, in the Coastal Plains region, however, Least Flycatchers posted a net loss of 15 occupied blocks between the two Atlases, and the losses in the Bristol/Narragansett Lowlands were even steeper. Interestingly, although Least Flycatchers also declined on Cape Cod and the Islands, the Boston Basin had 9 new occupied blocks where it previously had none.
Atlas 1 Map
Atlas 2 Map
Atlas Change Map
Ecoregion Data
Atlas 1 | Atlas 2 | Change | ||||||
Ecoregion | # Blocks | % Blocks | % of Range | # Blocks | % Blocks | % of Range | Change in # Blocks | Change in % Blocks |
Taconic Mountains | 13 | 81.3 | 3.4 | 21 | 84.0 | 5.1 | 2 | 13.3 |
Marble Valleys/Housatonic Valley | 39 | 100.0 | 10.1 | 39 | 100.0 | 9.4 | 0 | 0.0 |
Berkshire Highlands | 53 | 96.4 | 13.7 | 47 | 85.5 | 11.3 | -7 | -13.2 |
Lower Berkshire Hills | 26 | 92.9 | 6.7 | 27 | 87.1 | 6.5 | 1 | 3.7 |
Vermont Piedmont | 11 | 64.7 | 2.8 | 17 | 100.0 | 4.1 | 3 | 25.0 |
Berkshire Transition | 27 | 71.1 | 7.0 | 30 | 75.0 | 7.2 | 0 | 0.0 |
Connecticut River Valley | 22 | 39.3 | 5.7 | 31 | 47.7 | 7.5 | 4 | 8.3 |
Worcester Plateau | 53 | 67.9 | 13.7 | 71 | 80.7 | 17.1 | 3 | 6.3 |
Lower Worcester Plateau | 48 | 64.9 | 12.4 | 61 | 76.3 | 14.7 | 0 | 0.0 |
S. New England Coastal Plains and Hills | 61 | 22.6 | 15.8 | 55 | 19.4 | 13.3 | -15 | -6.6 |
Boston Basin | 0 | 0.0 | 0.0 | 9 | 16.1 | 2.2 | 9 | 16.4 |
Bristol and Narragansett Lowlands | 28 | 26.4 | 7.2 | 4 | 3.5 | 1.0 | -24 | -23.8 |
Cape Cod and Islands | 6 | 4.4 | 1.6 | 3 | 2.1 | 0.7 | -3 | -2.5 |
Statewide Total | 387 | 39.9 | 100.0 | 415 | 40.0 | 100.0 | -27 | -3.3 |
Notes
The Least Flycatcher shows a significant decreasing Breeding Bird Survey (BBS) trend in Massachusetts, in the New England/Mid-Atlantic Region, and in the Eastern US overall.They fall into our “whispering bird” category – those species with a demonstrated stable or increasing breeding footprint from Atlas 2 data, but also a demonstrated decline in abundance from the BBS. This drives our final assessment that this is a species with a need for further monitoring, especially in the southeast regions of the state.


