Find a Bird
Common Tern
Sterna hirundo
Local and likely increasing
Action/monitoring needed
Species of Special Concern
“Why did they make birds so delicate and fine as those sea swallows when the ocean can be so cruel?” – Ernest Hemingway, The Old Man and the Sea
At one time, the Common Tern was true to its name. This elegant fishing bird was the common seabird of early American shores, rather than the gulls that dominate our beaches today. During the late 1800s plume hunting reduced their numbers so drastically that concerned citizens felt compelled to organize and speak out against the demise of birds in the name of fashion. The Massachusetts Audubon Society was founded to stop the unregulated slaughter of birds for the millinery trade, and in honor of that groundbreaking achievement adopted a tern as its symbol.
Historic Status
In the early 1800s, Massachusetts fishermen looked to the Common Tern to announce the seasonal arrival of the mackerel, and as such they gave the species the nickname Mackerel Gull (Peabody 1839). Prior to the days of the millinery trade, the Common Tern was as common on the coast as any bird in Massachusetts. Then fashions changed. The birds were targeted as accessories for women's hats, and though Common Terns nested in the hundreds of thousands on Muskeget Island off Nantucket and numerous other places, they were practically wiped out by the dawn of the twentieth century. The plight was so great by 1889 that only 5,000 pairs remained; in 1896, Mass Audubon was established to help save the species. Under subsequent legal protection, the bird again began to flourish, reaching a population size of between 30,000 and 40,000 pairs by the 1920s. However the arrival of the Herring Gull in the 1900s to the Common Tern’s favored secluded, offshore breeding grounds resulted in yet another population crash. By the time of Atlas 1, fewer than 10,000 breeding pairs remained in Massachusetts.
Atlas 1 Distribution
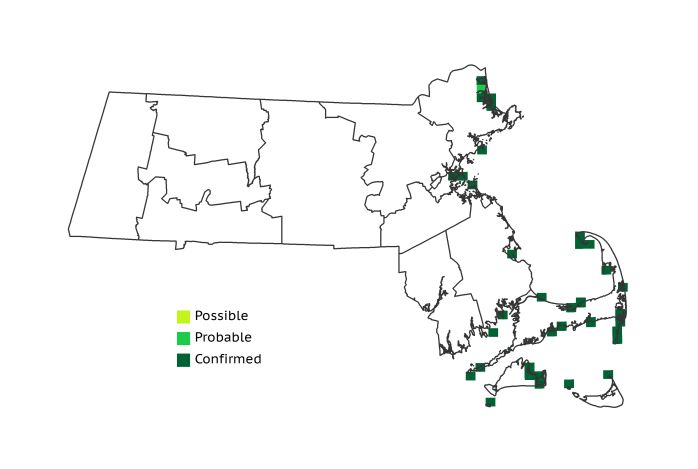
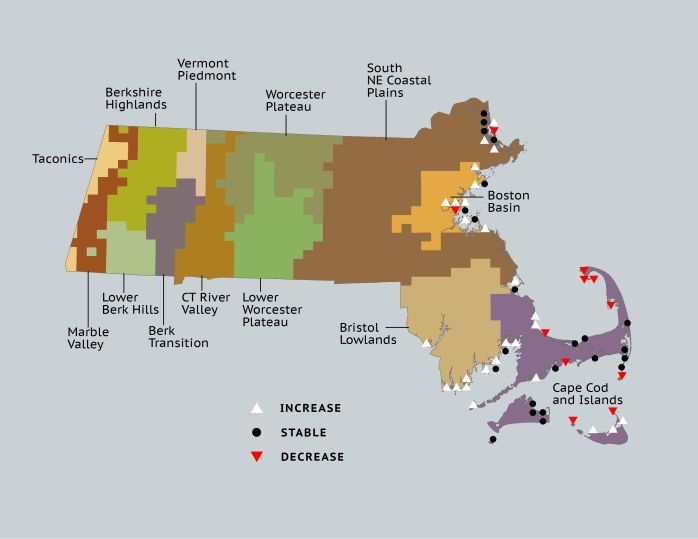
Common Tern colonies dotted the coast from Essex County to Nantucket County in Atlas 1. In fact, Essex County accounted for all five of the occupied Coastal Plains blocks, thanks to that region’s extensive system of coastal river deltas and salt marshes. In the Boston Basin, where at one time it would have been easier to count dead terns on hats than live terns on nests, 4 occupied blocks spoke to the species’ heartening recovery. The Bristol/Narragansett Lowlands had only 2 occupied blocks on the western shore of Buzzards Bay, but the Cape and Islands made up for this tenfold. Twenty-five of the state’s 36 occupied blocks in Atlas 1 were scattered throughout Cape Cod and the Islands, with particular concentrations at Provincetown, Monomoy National Wildlife Refuge, and Martha’s Vineyard.
Atlas 2 Distribution and Change
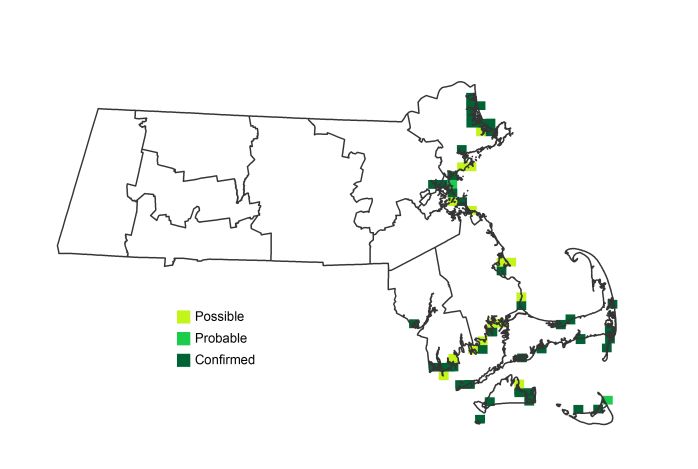
Common Terns have had a checkered history in the Commonwealth, with several notable bottlenecks in their population. Atlas data shows a gain in the number of occupied blocks, overall from 36 blocks in Atlas 1 to 57 in Atlas 2, and not surprisingly all are along the coast. The most notable increase in occupied blocks is in the Coastal Plains and the Bristol/Narragansett Lowlands. As with most colonially breeding species the Atlas is not the best tool for assessing changes in the Common Tern population (see Note below), although surveys by the Natural Heritage & Endangered Species Program show an increasing abundance for this species, which is consistent with the Atlas increasing footprint.
Atlas 1 Map
Atlas 2 Map
Atlas Change Map
Ecoregion Data
Atlas 1 | Atlas 2 | Change | ||||||
Ecoregion | # Blocks | % Blocks | % of Range | # Blocks | % Blocks | % of Range | Change in # Blocks | Change in % Blocks |
Taconic Mountains | 0 | 0.0 | 0.0 | 0 | 0.0 | 0.0 | 0 | 0.0 |
Marble Valleys/Housatonic Valley | 0 | 0.0 | 0.0 | 0 | 0.0 | 0.0 | 0 | 0.0 |
Berkshire Highlands | 0 | 0.0 | 0.0 | 0 | 0.0 | 0.0 | 0 | 0.0 |
Lower Berkshire Hills | 0 | 0.0 | 0.0 | 0 | 0.0 | 0.0 | 0 | 0.0 |
Vermont Piedmont | 0 | 0.0 | 0.0 | 0 | 0.0 | 0.0 | 0 | 0.0 |
Berkshire Transition | 0 | 0.0 | 0.0 | 0 | 0.0 | 0.0 | 0 | 0.0 |
Connecticut River Valley | 0 | 0.0 | 0.0 | 0 | 0.0 | 0.0 | 0 | 0.0 |
Worcester Plateau | 0 | 0.0 | 0.0 | 0 | 0.0 | 0.0 | 0 | 0.0 |
Lower Worcester Plateau | 0 | 0.0 | 0.0 | 0 | 0.0 | 0.0 | 0 | 0.0 |
S. New England Coastal Plains and Hills | 5 | 1.9 | 13.9 | 11 | 3.9 | 19.3 | 3 | 1.3 |
Boston Basin | 4 | 7.1 | 11.1 | 11 | 19.6 | 19.3 | 6 | 10.9 |
Bristol and Narragansett Lowlands | 2 | 1.9 | 5.6 | 10 | 8.8 | 17.5 | 7 | 6.9 |
Cape Cod and Islands | 25 | 18.4 | 69.4 | 25 | 17.4 | 43.9 | 0 | 0.0 |
Statewide Total | 36 | 3.7 | 100.0 | 57 | 5.5 | 100.0 | 16 | 1.9 |
Notes
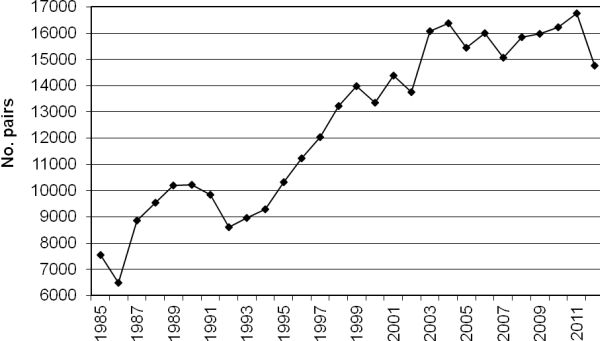
The challenges of using traditional Atlas methods to assess changes in colonial nesting species are well known. Single colonies are easy to miss, and even if a colony is reduced by 90%, the species is still recorded as breeding in the block. Estimates from counting pairs or nests are far more precise than Atlas field methods. This species is broadly distributed, and trends of their footprint do mirror the abundance trends noted in official surveys. The Natural Heritage & Endangered Species Program of the Massachusetts Division of Fisheries and Wildlife maintains the official counts for this species and other beach nesting birds (see graph below of the number of Common Tern pairs since 1985), and their recovery to approximately 15,000 pairs from the 10,000 estimated at the time of Atlas 1 is impressive. This has been accomplished with intense management at nesting sites that includes habitat restoration and maintenance, symbolic fencing, some beach closures and a corps of docents to help educate beachgoers about the sensitivity of beach nesting birds to disturbance. Without these measures there is every reason to believe this species, as well as Piping Plover, Least Tern, and Roseate Tern would once again slide inexorably downward.
