Find a Bird
Herring Gull
Larus argentatus
Local and likely increasing
“It is quite a thrill to discover that the birds you are studying are not simply specimens of the species Larus argentatus but that they are personal acquaintances.” – Niko Tinbergen, The Herring Gull’s World
When you think of the archetypal “seagull,” the chances are good that your mental image looks a lot like a Herring Gull. These iconic birds of the shore are large, boisterous, and willing to eat just about anything. Dumps full of garbage and offshore disposal sites for fish waste offer a veritable smorgasbord for hungry Herring Gulls, and consequently, they have become much more common in recent times than they were historically. Presently, the pendulum seems to be swinging in the other direction however.
Historic Status
The Herring Gull was an abundant spring and fall migrant in Massachusetts throughout the nineteenth century. Reginald Heber Howe and Glover Morrill Allen surmised, like others before them, that this species probably never bred in the state, even in the distant past. The only modern record at the time of their writing in 1901 included the caveat, “…and this, we believe, open to question—is of a pair said to have nested on the middle Wepecket Island, Buzzards Bay, in the summer of 1888.” George H. Mackay, the discoverer, wrote up that report in The Auk (Mackay 1892). Definite nesting came on Martha's Vineyard in 1912, with the discovery of a nest on Edgartown Great Pond, and in 1919 another nest was located on a sandbar called Skiff's Island off the Martha’s Vineyard coast. Their breeding numbers continued to increase gradually until their population exploded in the late 1940s. By the time of Atlas 1, the state boasted an estimated 36,250 pairs of nesting Herring Gulls.
Atlas 1 Distribution
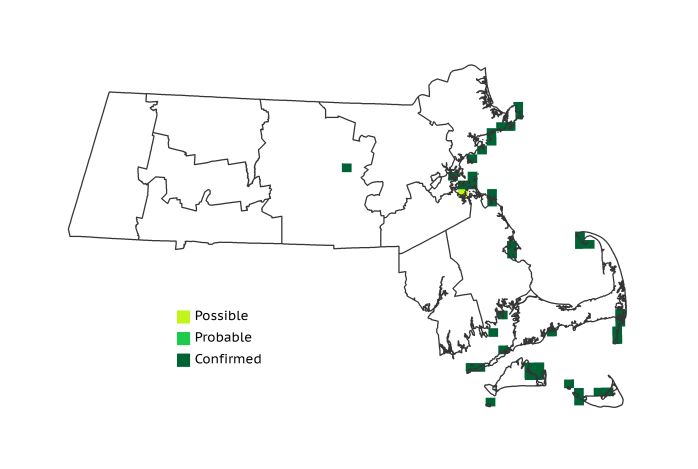
For a breeding species that had barely established a toehold in the Massachusetts scene by the turn of the twentieth century, the Herring Gull was doing well for itself by the time of Atlas 1. From Cape Ann southward, Herring Gull breeding colonies lined the shores of the Coastal Plains and the Boston Basin. The birds were particularly concentrated around Boston Harbor, where garbage and fishing offal, two of the species’ favorite food sources, were in ready supply. The only inland nesting block came from Wachusett Reservoir, where humans quickly dissuaded the gulls from nesting in order to protect the water supply. Offshore islands that were formerly occupied by terns and Laughing Gulls were quickly taken over by Herring Gulls, both around Buzzards Bay in the Bristol/Narragansett Lowlands as well as at a score of sites around Cape Cod and the Islands.
Atlas 2 Distribution and Change
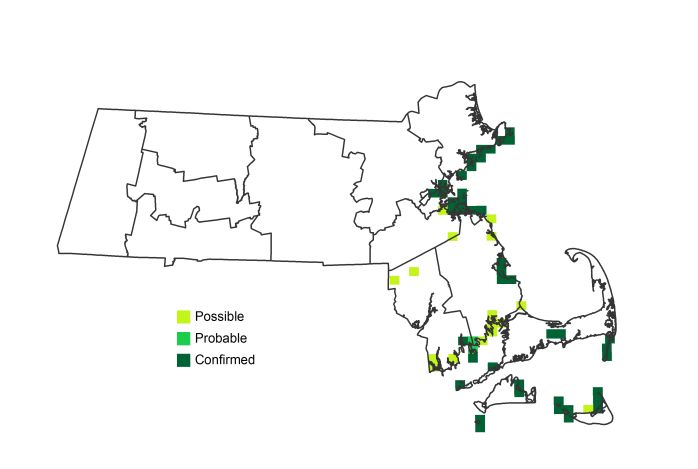
The Herring Gull was in for a reversal of fortune as the twentieth century drew to a close. Atlas 2 data show some gains and losses of colonies in individual blocks, but if they were the only data collected for colonially nesting birds one would assume the population was stable. Fortunately there are several other data sources that indicate a real decline for this species (see note below).
Atlas 1 Map
Atlas 2 Map
Atlas Change Map
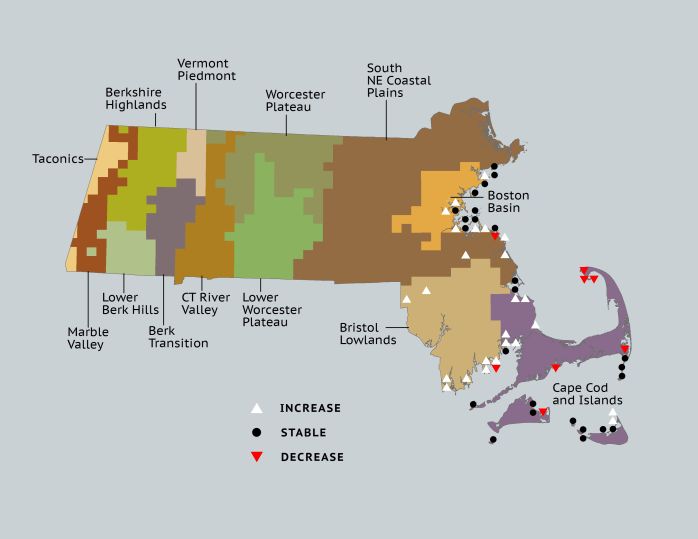
Ecoregion Data
Atlas 1 | Atlas 2 | Change | ||||||
Ecoregion | # Blocks | % Blocks | % of Range | # Blocks | % Blocks | % of Range | Change in # Blocks | Change in % Blocks |
Taconic Mountains | 0 | 0.0 | 0.0 | 0 | 0.0 | 0.0 | 0 | 0.0 |
Marble Valleys/Housatonic Valley | 0 | 0.0 | 0.0 | 0 | 0.0 | 0.0 | 0 | 0.0 |
Berkshire Highlands | 0 | 0.0 | 0.0 | 0 | 0.0 | 0.0 | 0 | 0.0 |
Lower Berkshire Hills | 0 | 0.0 | 0.0 | 0 | 0.0 | 0.0 | 0 | 0.0 |
Vermont Piedmont | 0 | 0.0 | 0.0 | 0 | 0.0 | 0.0 | 0 | 0.0 |
Berkshire Transition | 0 | 0.0 | 0.0 | 0 | 0.0 | 0.0 | 0 | 0.0 |
Connecticut River Valley | 0 | 0.0 | 0.0 | 0 | 0.0 | 0.0 | 0 | 0.0 |
Worcester Plateau | 0 | 0.0 | 0.0 | 0 | 0.0 | 0.0 | 0 | 0.0 |
Lower Worcester Plateau | 0 | 0.0 | 0.0 | 0 | 0.0 | 0.0 | 0 | 0.0 |
S. New England Coastal Plains and Hills | 10 | 3.7 | 24.4 | 11 | 3.9 | 18.0 | 2 | 0.9 |
Boston Basin | 7 | 12.5 | 17.1 | 13 | 23.2 | 21.3 | 6 | 10.9 |
Bristol and Narragansett Lowlands | 2 | 1.9 | 4.9 | 11 | 9.6 | 18.0 | 7 | 6.9 |
Cape Cod and Islands | 22 | 16.2 | 53.7 | 26 | 18.1 | 42.6 | 2 | 1.7 |
Statewide Total | 41 | 4.2 | 100.0 | 61 | 5.9 | 100.0 | 17 | 2.1 |
Notes
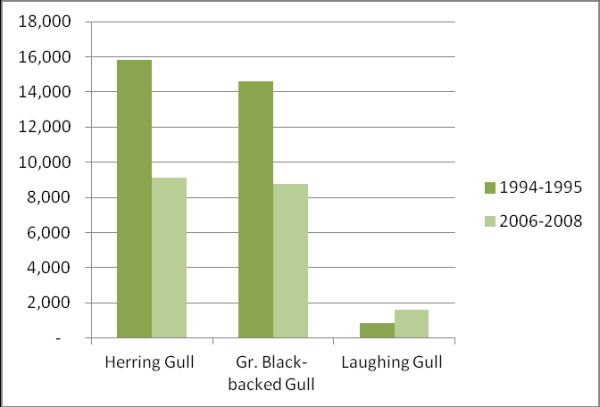
Surveys from the state Natural Heritage and Endangered Species Program comparing the number of breeding pairs of Herring Gulls in 1994-95 to those found during surveys in 2006-08 revealed a 42% decline (see table). Breeding Bird Survey data also show a sharp decline, despite the fact that Atlas 2 data show an increase in the number of blocks occupied. This species highlights one of the weaknesses in using Atlas surveys to estimate trends of colonial species. True colony censuses are needed to estimate the trends of the population because a colony can decline to one breeding pair and still be recorded as a Confirmation in the Atlas data, but it fails to indicate how many breeding pairs were present. For this species the estimates from the state Natural Heritage and Endangered Species Program biologists more accurately estimate the trend for this species.
The rise and fall of the Herring Gull population during the 1900s is likely due to a complex suite of factors. From a decline due to egging and the millinery trade in the late 1800s; to a protected, recovering, and well-fed population in the mid-1900s; to a declining population at the end of the 1900s—the fortunes of the Herring Gull have been dynamic. There are several key factors, for instance, Herring Gulls no longer have the same access they once had in the 1950s to the plentiful food provided by garbage dumps and the offal from fishing vessels due to new policies for dumps and fishermen. However, the looming uncertainty of sea-level rise due to climate change also paints a bleak picture for this species in the future.
