Find a Bird
American Woodcock
Scolopax minor
Widespread and likely increasing
State Wildlife Action Plan listed
“This mysterious hermit of the alders, this recluse of the boggy thickets, this wood nymph of crepuscular habits is a common bird and well distributed in our Eastern States, widely known, but not intimately known.” – Arthur Cleveland Bent, Life Histories of North American Birds
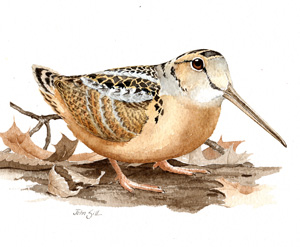
An early spring walk in the woods of Massachusetts is enriched by – some might say defined by – the sky-dance of the American Woodcock. This big-eyed, heavy-bodied bird is technically a member of the sandpiper family Scolopacidae, but they bear little resemblance to most of their relatives. Known colloquially as “timberdoodles” in many parts of their range, American Woodcocks have long been admired by birders for their unique presence, and pursued by hunters for their tender meat.
Historic Status
No bird better sets itself up to be shot than the American Woodcock, alighting and flying at close to shoulder height for the average shotgun-toting sportsman. A woodcock was even described to have clipped the ear of William Brewster as he walked a path on the Concord River with Edward Howe Forbush (Forbush 1925). Once thriving and abundant when grasslands and wet forest edges were numerous in Massachusetts, woodcocks suffered a population crash when market gunning reached its zenith in the late 1800s. Spring shooting killed woodcocks in great numbers, and then in July the gunners of autumn “located” the young birds in preparation for that season’s slaughter as soon as the season opened (Townsend 1905).
Atlas 1 Distribution
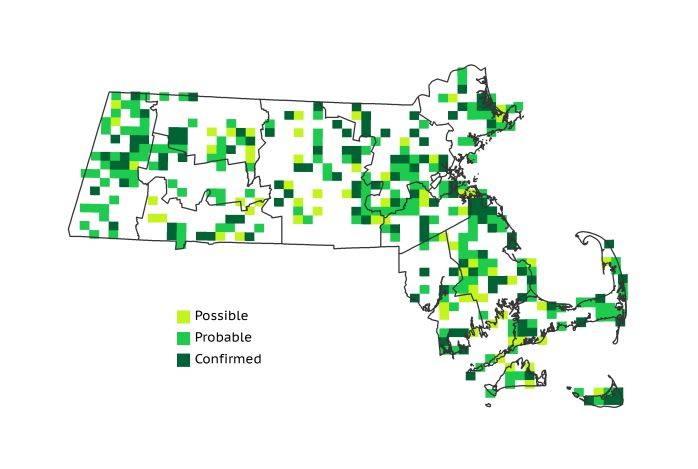
By the time of Atlas 1, the American Woodcock population had recovered from the ravages of widespread shooting thanks in part to the Migratory Bird Treaty Act of 1918, but development and increased human activity along its favored edge habitats still constrained its numbers. In the Marble Valleys and Berkshire Highlands, where small, natural forest gaps were common and people were relatively few, American Woodcocks showed block occupancy rates of 50% or better. The Lower Berkshire Hills had only 4 occupied blocks, however, and the Connecticut River Valley also hosted surprisingly few woodcocks despite the agricultural landscape. Woodcocks were present in less than a third of all blocks in the Worcester and Lower Worcester Plateaus, but they found a patchwork of protected wetlands and maturing forests (including scrubby Pitch Pine forests in southeastern Massachusetts) in the eastern ecoregions somewhat more hospitable.
Atlas 2 Distribution and Change
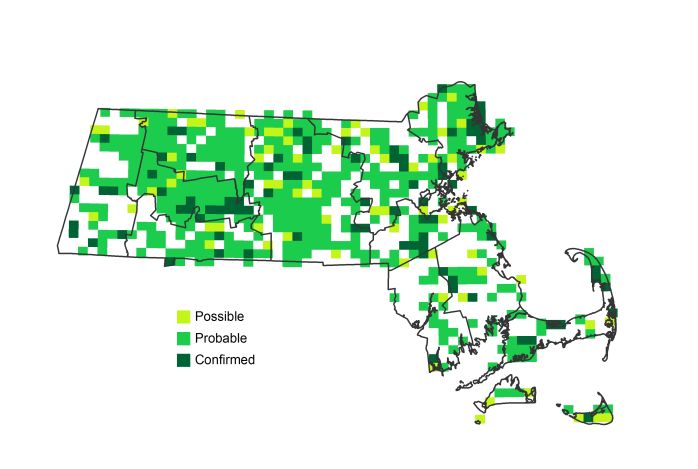
American Woodcocks have continued to fill in the gaps in their range, going from 38% block occupancy in Atlas 1 to 55% during Atlas 2. They are underrepresented on the Cape and Islands and the Bristol/Narragansett Lowlands but are otherwise distributed pretty much as expected across the state. Woodcocks even showed impressive growth in blocks where they previously went undetected in the Vermont Piedmont, Berkshire Highlands, Berkshire Transition, Connecticut River Valley, Worcester Plateau, and Lower Worcester Plateau ecoregions.
Atlas 1 Map
Atlas 2 Map
Atlas Change Map
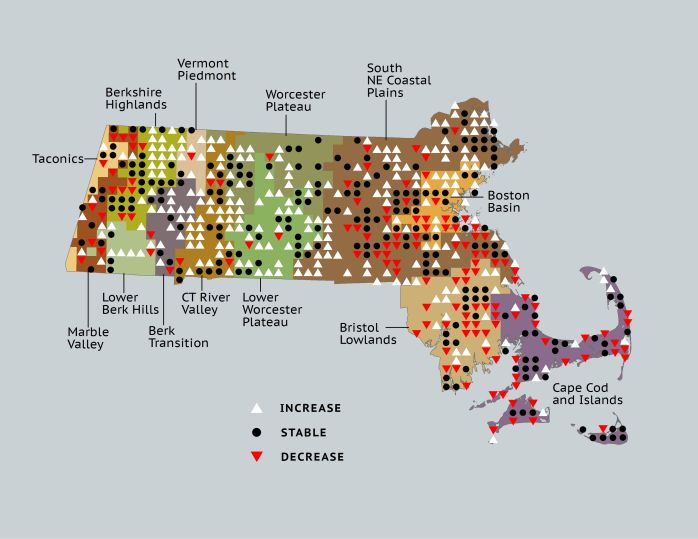
Ecoregion Data
Atlas 1 | Atlas 2 | Change | ||||||
Ecoregion | # Blocks | % Blocks | % of Range | # Blocks | % Blocks | % of Range | Change in # Blocks | Change in % Blocks |
Taconic Mountains | 5 | 31.3 | 1.4 | 7 | 28.0 | 1.2 | 1 | 6.7 |
Marble Valleys/Housatonic Valley | 21 | 53.8 | 5.7 | 16 | 41.0 | 2.8 | -5 | -12.8 |
Berkshire Highlands | 27 | 49.1 | 7.3 | 42 | 76.4 | 7.3 | 14 | 26.4 |
Lower Berkshire Hills | 4 | 14.3 | 1.1 | 11 | 35.5 | 1.9 | 6 | 22.2 |
Vermont Piedmont | 4 | 23.5 | 1.1 | 13 | 76.5 | 2.3 | 5 | 41.7 |
Berkshire Transition | 11 | 28.9 | 3.0 | 27 | 67.5 | 4.7 | 12 | 38.7 |
Connecticut River Valley | 18 | 32.1 | 4.9 | 51 | 78.5 | 8.9 | 23 | 47.9 |
Worcester Plateau | 22 | 28.2 | 5.9 | 70 | 79.5 | 12.2 | 20 | 41.7 |
Lower Worcester Plateau | 19 | 25.7 | 5.1 | 55 | 68.8 | 9.6 | 23 | 42.6 |
S. New England Coastal Plains and Hills | 106 | 39.3 | 28.6 | 166 | 58.7 | 28.9 | 34 | 15.0 |
Boston Basin | 24 | 42.9 | 6.5 | 32 | 57.1 | 5.6 | 8 | 14.5 |
Bristol and Narragansett Lowlands | 44 | 41.5 | 11.9 | 35 | 30.7 | 6.1 | -11 | -10.9 |
Cape Cod and Islands | 65 | 47.8 | 17.6 | 49 | 34.0 | 8.5 | -17 | -14.2 |
Statewide Total | 370 | 38.2 | 100.0 | 574 | 55.4 | 100.0 | 113 | 13.6 |


