Find a Bird
Osprey
Pandion haliaetus
Somewhat local and strongly increasing

“Its shrill scream seems yet to linger in its throat, and the roar of the sea in its wings. There is the tyranny of Jove in its claws, and his wrath in the erectile feathers of the head and neck.” Henry David Thoreau, Natural History of Massachusetts
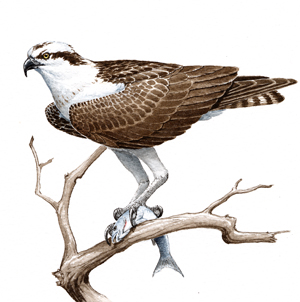
Ospreys are back, in force, along the coast of the Bay State. The history of these so-called Fish Hawks is fraught with troubled times, yet Ospreys have managed to hang on despite adversity. Today, Ospreys can be seen throughout the Commonwealth, feeding in reservoirs, ponds, bays, and wherever else there are fish to be caught. They declined because humans were unknowingly poisoning them, and they returned because humans learned what they were doing, took action, and stopped. Their loss from coastal communities was a blight, and people responded with a large-scale nest platform building program, which not only was successful, but also made both the human and bird communities richer.
Historic Status
Ospreys have suffered not one, but two, known population bottlenecks in Massachusetts. As tree nesters, they likely found the deforestation that accompanied the rapid increase in farmland during the Colonial era likely devastating to their breeding in the state. By the 1920s, Forbush believed they had significantly declined from what he postulated to have been a widespread breeding distribution prior to European settlement. He further noted that only in Swansea, where they were protected by farmers, did they survive. Poultry farmers in that area apparently realized that the ferocity with which Ospreys protected their young offered unexpected benefits to their livestock because the birds drove chicken-hunting hawks away from their farms. The farmers even took to erecting poles with wagon wheels atop them to serve as nest platforms, to which the ospreys took naturally (Forbush 1927). The population in the state remained relatively stable, mostly in southeastern Massachusetts, through World War II. Following the war, the overuse of newly created and widely used organochlorine pesticides such as DDT decimated the population, knocking the Commonwealth’s 60 to 80 known nesting pairs down to just 11 by 1964 (Petersen & Meservey 2003). The ban on DDT in the next decade no doubt saved the Massachusetts Osprey population from extirpation.
Atlas 1 Distribution
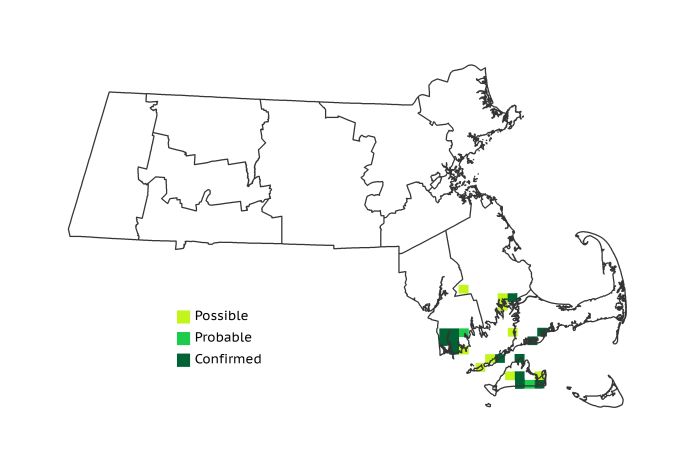
Ospreys may have been entirely restricted to southeastern Massachusetts in Atlas 1, but their distribution was still impressive considering their near-extirpation only one decade before that. Ospreys were found nesting – often on artificial poles erected specifically for that purpose – in the southeastern Bristol/Narragansett Lowlands, near the border with Rhode Island. Many of the breeding records on Cape Cod and the Islands were scattered around Buzzards Bay and the Elizabeth Islands, although Martha’s Vineyard also had more than a half-dozen occupied blocks.
Atlas 2 Distribution and Change
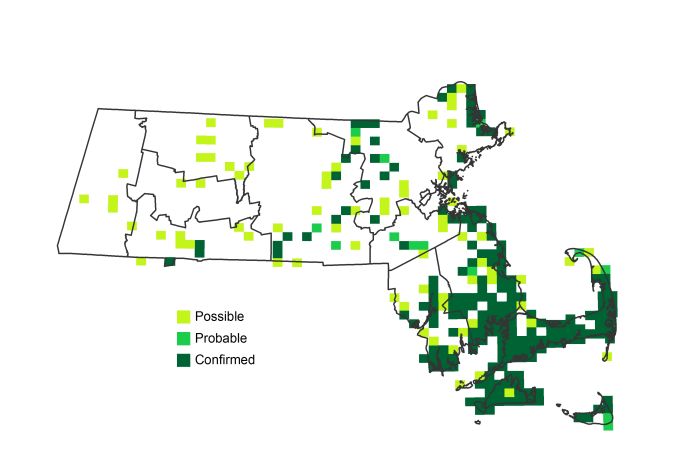
The recovery represented by the Atlas 2 distribution of Ospreys is the result of dedicated work by multiple parties, including utility companies, concerned citizen groups, and federal and state partners. Ospreys were found as far west as the Berkshires and were Confirmed breeding in the Connecticut River Valley. They were also present, albeit sparingly, throughout the Worcester Plateau regions, and occupied many blocks in the Coastal Plains with several pairs using recently erected cell phone towers. The noteworthy inland presence of breeding Ospreys during Atlas 2 was a testament to how much the species had recovered in just a few decades. Ospreys were sparse in the Boston Basin, but the Bristol/Narragansett Lowlands had breeding Ospreys in almost half of all blocks. Cape Cod and the Islands remained by far the most important ecoregion for Ospreys, representing 40% of the species’ occupied blocks in Massachusetts. More than 75% of all Cape Cod and Islands blocks reported breeding Ospreys, including most of Nantucket where the species was totally absent in the first Atlas.
Atlas 1 Map
Atlas 2 Map
Atlas Change Map
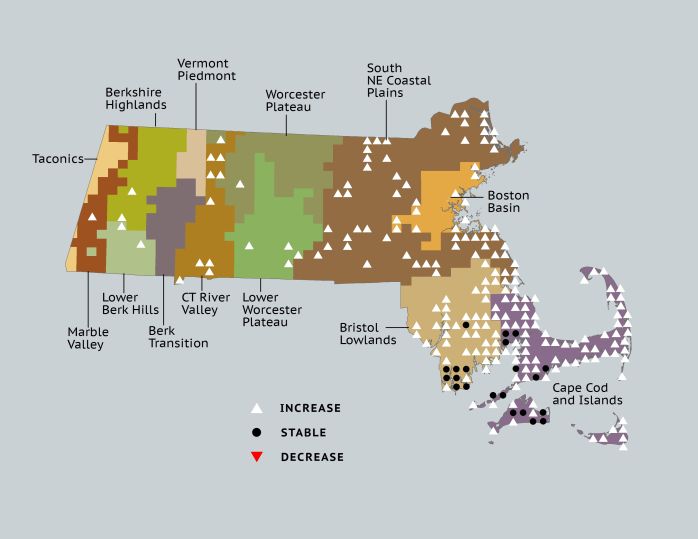
Ecoregion Data
Atlas 1 | Atlas 2 | Change | ||||||
Ecoregion | # Blocks | % Blocks | % of Range | # Blocks | % Blocks | % of Range | Change in # Blocks | Change in % Blocks |
Taconic Mountains | 0 | 0.0 | 0.0 | 0 | 0.0 | 0.0 | 0 | 0.0 |
Marble Valleys/Housatonic Valley | 0 | 0.0 | 0.0 | 1 | 2.6 | 0.4 | 1 | 2.6 |
Berkshire Highlands | 0 | 0.0 | 0.0 | 2 | 3.6 | 0.7 | 2 | 3.8 |
Lower Berkshire Hills | 0 | 0.0 | 0.0 | 3 | 9.7 | 1.1 | 2 | 7.4 |
Vermont Piedmont | 0 | 0.0 | 0.0 | 0 | 0.0 | 0.0 | 0 | 0.0 |
Berkshire Transition | 0 | 0.0 | 0.0 | 2 | 5.0 | 0.7 | 0 | 0.0 |
Connecticut River Valley | 0 | 0.0 | 0.0 | 11 | 16.9 | 4.0 | 9 | 18.8 |
Worcester Plateau | 0 | 0.0 | 0.0 | 6 | 6.8 | 2.2 | 2 | 4.2 |
Lower Worcester Plateau | 0 | 0.0 | 0.0 | 8 | 10.0 | 2.9 | 4 | 7.4 |
S. New England Coastal Plains and Hills | 0 | 0.0 | 0.0 | 68 | 24.0 | 24.5 | 57 | 25.2 |
Boston Basin | 0 | 0.0 | 0.0 | 12 | 21.4 | 4.3 | 11 | 20.0 |
Bristol and Narragansett Lowlands | 8 | 7.5 | 33.3 | 53 | 46.5 | 19.1 | 42 | 41.6 |
Cape Cod and Islands | 16 | 11.8 | 66.7 | 111 | 77.1 | 40.1 | 80 | 66.7 |
Statewide Total | 24 | 2.5 | 100.0 | 277 | 26.7 | 100.0 | 210 | 25.3 |
Notes
The Osprey shows a significant increasing Breeding Bird Survey trend in the mid-Atlantic region.


